InfluxDB and Grafana
Christian Gorenflo and Niko FinkWaterloo, 2016-11-23
iss4e.github.io/influxdb-talk
Why InfluxDB?
| InfluxDB | MySQL |
|---|---|
Time Series DBMS 
|
Relational DBMS  ©
Neo4j
©
Neo4j
|
| Schema-Free | Static Schema |
| Int, Float, String, Bool | various different data types |
| No Transactions | Full ACID |
| InfluxDB | MySQL |
|---|---|
| Optimized for Creates and Reads | Good for all CRUD Operations |
| Rows with Timestamps | Rows with Relations |
| Columns can be defined on-the-fly | Schema has to be defined first |
| Missing fields are not saved | Missing fields consume space |
| InfluxDB | kdb+ |
|---|---|
| open-source | proprietary (free academic license) |
| TICK stack environment and active community | hardly any additional software |
| very easy setup, use existing tooling for complex tasks | easy for simple scenarios a nightmare for complex tasks |
| InfluxDB | kdb+ |
|---|---|
| ~10.000 writes/sec | ~100.000 writes/sec |
| SQL-like | SQL-like |
| HTTP API easy to use python connector |
python connector sends q commands directly to kdb+ difficult to use |
 TICK-Stack
+
TICK-Stack
+
 Grafana
 © InfluxData
 © alexanderzobnin
Data Organization
Line Protocol
<measurement>[,<tag-key>=<tag-value>...]⎵⤦
<field-key>=<field-value>[,<field2-key>=<field2-value>...]⎵⤦
[unix-nano-timestamp]\n
sensor_data,imei=6089⎵⤦
acceleration_x=0.6939569,acceleration_y=0.3649411⎵⤦
1434067467000000000\n
| measurement | table name |
|---|---|
| tags | secondary indices (strings) |
| fields | values (any type) |
| time | unix timestamp in nanoseconds |
name: sensor_data
-----------------
time                      imei  acceleration_x  acceleration_y  ...
2016-05-06T15:50:48.811Z  6089  0.6939569       0.3649411       ...
2016-05-06T15:50:49.812Z  6089  0.6933582       0.34473312      ...
2016-05-06T15:50:50.815Z  6089  0.6730005       0.34488282      ...
2016-05-06T15:50:51.828Z  6089  0.6836284       0.3466791       ...
Tags vs Fields
- tags are indexed, fields are not
- data on disk is grouped by tags
- too many tags make InfluxDB slow
-
only fields can be used in functions and
only tags can (and should) be used for grouping - you have to query at least one field
Querying Data
...with InfluxQLQuery Format
| SELECT | * | [time,][tag_key,...]field_key |
|---|---|
| FROM | measurement,... |
| WHERE | key =|!=|<=|~= 'value'|"key" |
| GROUP BY | tag_key,... |
| LIMIT | count |
Selectors
> SELECT FIRST(source) FROM samples GROUP BY participant
name: samples
tags: participant=1
time			first
----			-----
2013-05-03T19:44:52Z	5386977

name: samples
tags: participant=10
time			first
----			-----
2014-05-29T19:27:28.08Z	5247600
Aggregations
> SELECT MEAN(veh_speed) FROM samples [...] GROUP BY time(10m)
name: samples
tags: participant=1
time			mean
----			----
2013-05-07T21:20:00Z	1.7622126436781609
2013-05-07T21:30:00Z	34.93495879120879
2013-05-07T21:40:00Z	26.179286858974358
2013-05-07T21:50:00Z	14.843560606060606
2013-05-07T22:00:00Z	40.82345744680851

name: samples
tags: participant=10
time			mean
----			----
2014-05-29T19:20:00Z	9.842592592592593
2014-05-29T19:30:00Z	74.25445103857567
2014-05-29T19:40:00Z	62.88461538461539
2014-05-29T19:50:00Z	41.599609375
2014-05-29T20:00:00Z	40.21259842519685
Functions
| Aggregations | Selectors | Transformations |
|---|---|---|
| COUNT() | BOTTOM() | CEILING() |
| DISTINCT() | FIRST() | CUMULATIVE_SUM() |
| INTEGRAL() | LAST() | DERIVATIVE() |
| MEAN() | MAX() | DIFFERENCE() |
| MEDIAN() | MIN() | ELAPSED() |
| MODE() | PERCENTILE() | FLOOR() |
| SUM() | SAMPLE() | HISTOGRAM() |
| STDDEV() | TOP() | MOVING_AVERAGE() |
Python Client
iss4e lib
|
|
~/iss4e.conf
|
script.py
|
Query
config = load_config()
client = InfluxDBClient(**config["drive4data.influx"])
res = client.query("SELECT * FROM samples
                        GROUP BY participant LIMIT 5;")
for point in res.get_points():
    print(point)

# {'time': 3000, 'hv_crnt': 0,     'gps_lat_deg': None, ...}
# {'time': 3009, 'hv_crnt': -3.9,  'gps_lat_deg': None, ...}
# {'time': 3080, 'hv_crnt': -3.9,  'gps_lat_deg': None, ...}
# {'time': 3200, 'hv_crnt': -3.9,  'gps_lat_deg': None, ...}
# {'time': 3890, 'hv_crnt': -3.59, 'gps_lat_deg': None, ...}
# {'time': 4080, 'hv_crnt': None,  'gps_lat_deg': None, ...}
Write
timestamp            participant  speed  soc
2016-11-14 17:20:14  5            0      0.8
2016-11-14 17:21:18  7            20     0.4
2016-11-14 17:22:34  9            0      1.0
...
csv_rows = csv.DictReader(open("samples.csv"))
client.write_points({
  'measurement': 'samples',
  'time': parse_time(row.pop('timestamp')),
  'tags': {
    'participant': row.pop('participant')
  },
  'fields': row
} for row in csv_rows)
Parallelization
executor = ProcessPoolExecutor(max_workers=16)
series = client.list_series("samples")
futures = [executor.submit(my_func, selector)
                    for tags, selector in series]
data = [f.result() for f in futures]

def my_func(selector):
    stream = client.stream_params(
        "samples",
        fields="veh_speed",
        where=selector
    )
    return np.histogram([
        row['veh_speed'] for row in stream
    ])
InfluxDB internals
and lessons learnt

Data Storage
- insert and read optimized, delete and update slow
-
data is stored in a LevelDB:
· WAL+Cache: fast writes, slow reads
↓ gets compacted into ↓
· TSM-Shards: slow compactions, fast reads
-
data is stored in "dense" per-field columns,
not in sparse rows
...consequences
- row with same time and tags overwrites previous row
-
only fields can be selected and
only tags can (and should) be used for grouping - high series cardinality heavily impacts performance
- collecting data from all series/shards is time consuming
Bugs
- querying across series can be extremely slow
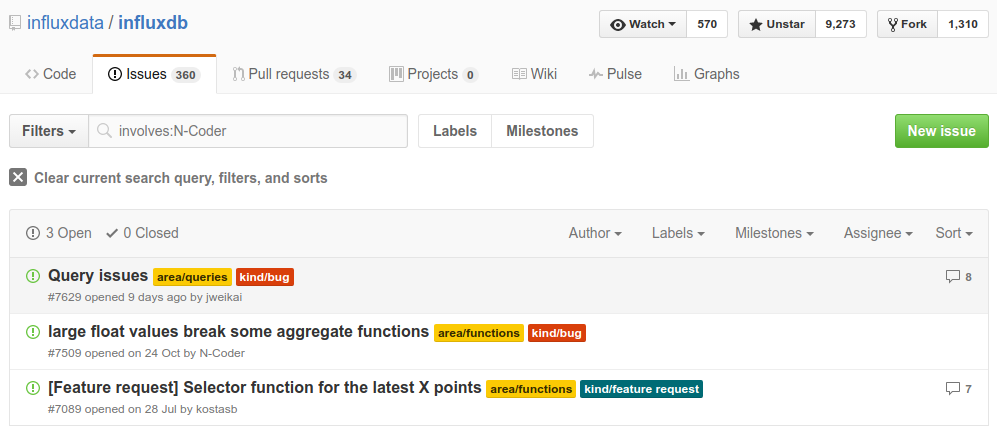
- large float values (~1.8+308) break aggregations
-
when data is inserted in random order,
wrong shards boundaries could be created - ODER BY time DESC was added in 1.2
- most of the functions can't be nested / combined